
Revenue per visitor (RPV): the north-star metric for VSL tests, with EPC, RPM and break-even math
Revenue per visitor is total revenue divided by unique visitors. It folds conversion rate, order value and upsells into one number you can compare directly with your cost per visitor. Here are the formulas, the break-even math, and the traps that make RPV mislead.
On this page
- How do you calculate revenue per visitor?
- Why RPV beats conversion rate for judging VSL tests
- RPV vs EPC vs RPM vs revenue per view
- How to calculate break-even RPV from your ad costs
- How sample size and outliers distort RPV
- Using RPV to judge headlines, posters, offers and traffic sources
- Using RPV to decide how far to scale
- An RPV checklist for your next test
- Frequently asked questions
Revenue per visitor (RPV) is total revenue divided by unique visitors in the same period. Because it equals conversion rate times revenue per buyer, upsells included, it tells you in one number whether a VSL change made money, and you can compare it directly with what each visitor costs. Break-even RPV is your cost per visitor divided by your contribution margin.
How do you calculate revenue per visitor?
Revenue per visitor
RPVtotal revenue ÷ unique visitors
RPVconversion rate × revenue per buyer
Say 3,000 visitors produce 66 orders and $5,940 of revenue, front end plus upsells. RPV = $5,940 ÷ 3,000 = $1.98. The same number falls out of its two parts: conversion rate (66 ÷ 3,000 = 2.2%) times revenue per buyer ($5,940 ÷ 66 = $90), and 0.022 × $90 = $1.98. RPV is the last link in the VSL metrics chain, the number every stage above it feeds.
Put your own numbers in here. The calculator starts with this example and the 60% margin used in the break-even section below:
Calculator
Revenue per visitor calculator
From one traffic source or one VSL over the same period.
- Conversion rate
- orders ÷ unique visitors
- Revenue
- Break-even cost per visitor
- the most a visitor can cost you
If one ad click brings one visitor, the break-even cost per visitor is also your break-even cost per click.
What you put into "revenue" decides what the number means:
- Include everything the visit produced: front-end orders, order bumps, upsells and downsells. Leaving out upsells hides the effect of any change that alters who buys.
- Use net revenue once refunds and chargebacks have had time to arrive. Until then, apply your own historical refund rate.
- Keep one attribution rule. If a visitor buys three days later from an email, decide whether that sale belongs to the visit, then apply the rule to every variant.
- Report in one currency, converted at a consistent rate.
Why RPV beats conversion rate for judging VSL tests
Conversion rate counts buyers. RPV counts money. Many VSL tests move both, and sometimes in opposite directions. Three illustrative tests:
Higher conversion rate, lower RPV, three times
Three illustrative tests: revenue per visitor of each version
In every pair, the version with the higher conversion rate earns less per visitor. A cheaper price brings more buyers who spend less. Showing the single unit first sells more single units. A curiosity headline can pull in buyers who were less sure of what they wanted and who skip the upsells. Judged by conversion rate, you would pick the losing version all three times.
RPV also connects straight to your costs. Conversion rate can't tell you whether a visitor who cost $1.50 paid for themselves; RPV can. The VSL conversion rate guide shows the same logic from the conversion side, as a break-even conversion rate, and the VSL offer guide covers presenting bundles and prices.
RPV vs EPC vs RPM vs revenue per view
Here are the five side by side:
Five revenue metrics, and what each is best for
RPVrevenue ÷ unique visitors. Best for: judging pages, tests and sources
Revenue per viewrevenue ÷ page loads. Best for: infrastructure-level reporting
Revenue per viewerrevenue ÷ visitors who started the video. Best for: judging the video apart from the page
EPCrevenue ÷ CTA clicks. Best for: judging the offer and checkout
RPMRPV × 1,000. Best for: reading small RPV changes
How to use them together:
- EPC isolates the back half of the funnel. If EPC holds while RPV falls, fewer people are clicking, so look at the video and the pitch. If EPC falls while CTA click rate (CTA clicks ÷ pitch viewers) holds, buyers are being lost after the click, so look at the offer page and the checkout.
- EPC means different things in different places. A dashboard may compute it per buy-button click, an affiliate network per affiliate-link click, a media buyer per ad click. Confirm the definition before you compare two reports.
- RPM is not comparable with CPM. Your ad's CPM is cost per 1,000 impressions; RPM here is revenue per 1,000 visitors. To compare money in with money out, set RPV against cost per visitor.
- Pick visitors or views and stay there. If 2,000 visitors produce 2,500 page loads and $4,000, RPV is $2.00 and revenue per view is $1.60. Both are correct; mixing them across tools or variants is not. In a split test, assign and count by visitor: if one variant makes people reload more (a slow page, say), revenue per view penalizes it for the reloads as well as for any lost sales.
In RevvyScales, the analytics report RPV, EPC and RPM alongside revenue, orders and conversion rate, with per-variant breakdowns for tests (reading your analytics).
How to calculate break-even RPV from your ad costs
Cost per visitor (CPV) = ad spend ÷ unique visitors = CPC ÷ landing rate, where landing rate is unique visitors ÷ link clicks. Working from CPM instead: CPV = CPM ÷ (1,000 × CTR × landing rate).
Contribution margin (m) = the share of revenue left after product costs, fulfillment, payment fees and affiliate commissions, before ad spend. If your revenue figure still includes orders that will be refunded, subtract refunds here too.
The two formulas to remember
Break-even RPVCPV ÷ m
Profit per visitorRPV × m − CPV
Worked example: a $15 CPM, a 1.25% CTR and an 80% landing rate give CPV = $15 ÷ (1,000 × 0.0125 × 0.80) = $1.50. With a 60% margin, break-even RPV = $1.50 ÷ 0.60 = $2.50. A page earning $2.80 per visitor makes $2.80 × 0.60 − $1.50 = $0.18 per visitor, or $1,800 per 10,000 visitors.
Run the formula backward to find the most you can pay for a click: break-even CPC = RPV × m × landing rate. At an RPV of $2.80, that is $2.80 × 0.60 × 0.80 = $1.34.
This turns traffic decisions into arithmetic. Here are three illustrative ad sets feeding the same VSL, with a 60% margin. A and B land 80% of their clicks; C lands 75%:
Three ad sets feeding one VSL
Illustrative numbers, 60% margin
Makes a little moneyAd set A
- Landing rate: 80%
- CPC: $0.80
- Conversion rate: 1.6%
- RPV: $1.76
- +$0.06 profit per visitor
- Break-even CPC: $0.84
Loses moneyAd set B
- Landing rate: 80%
- CPC: $1.60
- Conversion rate: 3.0%
- RPV: $3.00
- −$0.20 profit per visitor
- Break-even CPC: $1.44
Same RPV as B, lower CPVAd set C
- Landing rate: 75%
- CPC: $1.20
- Conversion rate: 2.4%
- RPV: $3.00
- +$0.20 profit per visitor
- Break-even CPC: $1.35
Ad set B has the best conversion rate and loses money on every visitor, because it pays more per click than its RPV can support. C earns the same RPV at a lower cost per visitor ($1.60 against B's $2.00). A converts worst and still makes a little money, because its clicks are cheap.
How sample size and outliers distort RPV
Most visitors are worth $0
At a 2.5% conversion rate, 97.5% of visitors produce no revenue and a few produce a lot. That makes RPV much noisier than it looks. Its uncertainty is measured by the standard error of the mean: the standard deviation of revenue per visitor divided by the square root of the number of visitors. With thousands of visitors, a 95% confidence interval is roughly RPV ± 1.96 standard errors (NIST on confidence limits for the mean).
When every order is worth about the same amount A, there is a shortcut:
Worked example: 2,000 visitors, 50 orders of $100 each. RPV = $2.50. Standard error = $100 × √(0.025 × 0.975 ÷ 2,000) = $0.35. The 95% interval runs from about $1.82 to $3.18, so with 2,000 visitors you know this page's RPV only to within roughly ±27%.
When order values vary (bundles at $69, $177 and $294, say), the spread is wider still. In that case, compute the standard deviation in a spreadsheet from one row per visitor, zeros included, rather than from the orders alone.
How much traffic an RPV test needs
Now add version B: 60 orders of $100 on 2,000 visitors, so RPV = $3.00, a 20% lift. B's standard error is $0.38. The standard error of the difference is √(0.35² + 0.38²) = $0.52, so the $0.50 lift is less than one standard error from zero (z ≈ 0.97). For 95% confidence, z needs to reach 1.96. If those rates held, you would need about 8,200 visitors per version just to reach that line, and about 16,800 per version to have an 80% chance of detecting a true 20% lift.
The lesson isn't to stop judging by RPV. It's to plan for the traffic, judge on complete weeks, and use faster metrics (play rate, pitch reach, CTA click rate) to stop clear disasters early while RPV decides the close calls. The VSL A/B testing guide covers test design in full.
One big order can flip a test
Version A: 1,500 visitors and 30 orders of $60, so RPV = $1.20. Version B: 1,500 visitors, 28 orders of $60 plus one $900 order from someone who bought fifteen units, so RPV = ($1,680 + $900) ÷ 1,500 = $1.72. B looks 43% better.
Now cap every order at your largest standard bundle, say $180, using a rule you set before the test began. B becomes ($1,680 + $180) ÷ 1,500 = $1.24. A 3% lead, built on one fewer order than A, is noise.
Here is the same test before and after the cap:
One $900 order flips the test
Illustrative: 1,500 visitors per version, orders of $60
Ways to protect a test:
- Cap order values at a level set in advance, such as your largest standard bundle or a high percentile of past orders, and report capped RPV next to raw RPV.
- Recompute without the top order or two. If the winner changes, you don't have a winner yet.
- Look at the parts. A real RPV win normally shows up in conversion rate, revenue per buyer or both, across several days rather than in a single order.
Using RPV to judge headlines, posters, offers and traffic sources
| What you're testing | Decide by | Early read | Guardrails |
|---|---|---|---|
| Headline or poster | RPV | play or unmute rate, pitch reach | refund rate |
| Video edit or lead | RPV | pitch retention | refund rate |
| Offer, price or bundles | RPV | CTA click rate, revenue per buyer | refund rate, support tickets |
| Upsells | RPV | upsell take rate | front-end refunds |
| Traffic source or ad set | profit per visitor | landing rate, play rate | refund rate |
Two notes:
- Traffic sources are judged on profit, not RPV alone, because their costs differ. Compute profit per visitor = RPV × m − CPV for each source, as in the ad-set table above.
- Automated traffic shifting follows the same math. In RevvyScales, smart traffic split (Growth plan and up) moves a folder's traffic toward the VSLs earning the most per viewer, judged on complete days (smart traffic split). Whether you shift traffic by hand or let a tool do it, RPV needs enough volume before a lead means anything.
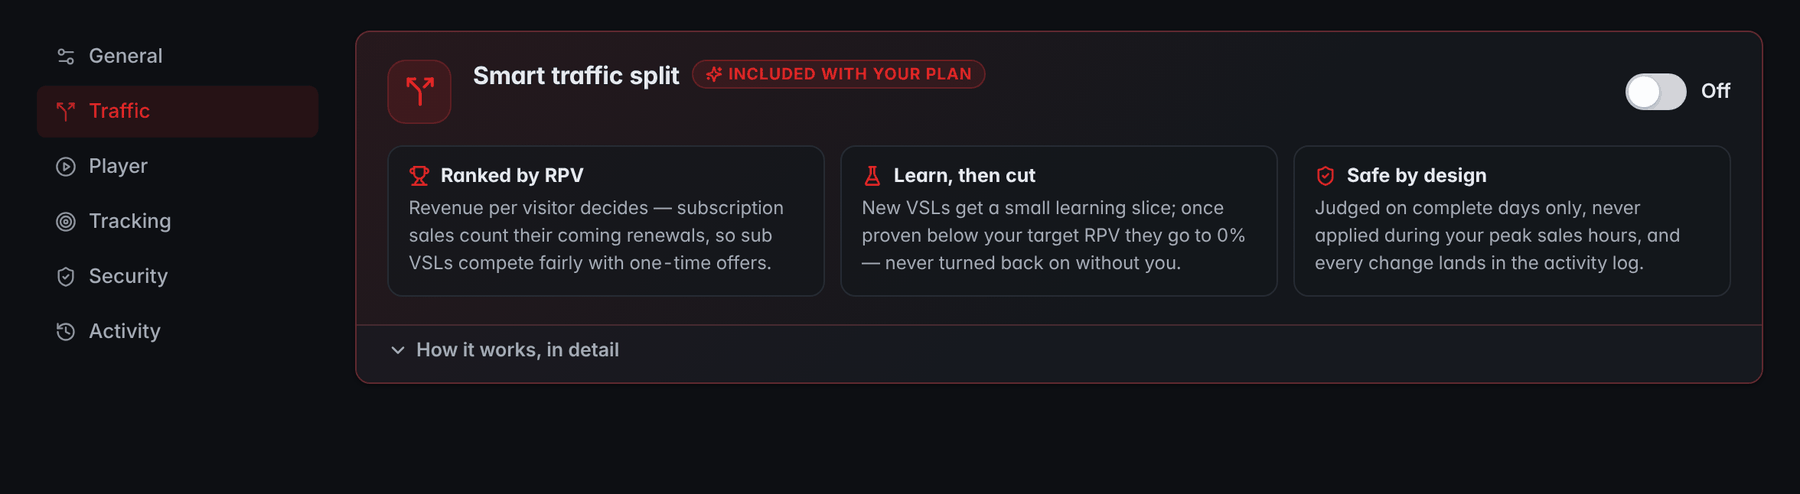
- Ranked by RPVRevenue per visitor decides which of the folder's VSLs gets more traffic.
- Complete daysChanges are judged on complete days only, and each one lands in the activity log.
Upsells deserve separate attention because they change revenue per buyer without touching conversion rate; the upsell funnel guide covers the offer side.
Using RPV to decide how far to scale
Averages hide what happens at the margin. When you raise a budget, the platform has to find more people, and both cost per visitor and RPV can move. Judge the extra spend by the extra visitors it buys, not by the new blended average.
An illustrative example, with a 60% margin:
Scaling from $600 to $1,800 a day
Illustrative example, 60% margin
$600 a day
- CPV: $1.50
- Visitors: 400
- RPV: $2.80
- Revenue: $1,120
- +$72 profit after ads
$1,800 a day
- CPV: $1.80
- Visitors: 1,000
- RPV: $2.70
- Revenue: $2,700
- −$180 profit after ads
What the extra $1,200 a day bought
- 600 extra visitors at $2.00 each
- $1,580 of extra revenue, or $2.63 per visitor
- Each extra visitor lost $0.42
The blended RPV barely moved, from $2.80 to $2.70, which looks harmless. But the extra $1,200 a day bought 600 extra visitors at $2.00 each, and they produced $1,580 of revenue, or $2.63 per visitor. On average, each extra visitor lost $0.42 ($2.63 × 0.60 − $2.00), enough to turn a profitable campaign into a losing one.
The decision rule:
- Marginal CPV = extra spend ÷ extra visitors
- Marginal RPV = extra revenue ÷ extra visitors
- Keep scaling while marginal RPV × margin stays above marginal CPV. Raise budgets in steps and give each step complete days before you compare.
An RPV checklist for your next test
Tick these off as you plan and run the test; the ticks stay in this browser:
Seven checks for an RPV test
0 of 7 done
Frequently asked questions
What is a good revenue per visitor for a VSL?
Any RPV above your break-even, which is your cost per visitor divided by your contribution margin. If visitors cost $1.50 and you keep 60% of revenue after product costs, fees and refunds, you need at least $2.50 per visitor. Generic RPV benchmarks ignore your prices, costs and traffic, so they can't tell you whether yours is good.
Is revenue per visitor the same as average order value?
No. Average order value is revenue divided by orders, so it only describes the people who bought. Revenue per visitor divides the same revenue by every visitor, buyers or not, so it equals conversion rate times revenue per buyer. A change that raises order value but loses buyers can lower revenue per visitor, which is why RPV is the better test metric.
Should RPV include upsells and refunds?
Yes to both, eventually. Include upsells, bumps and downsells, because many VSL changes affect how much buyers spend as well as how many buy. Refunds take weeks to arrive, so while a test runs, use gross revenue with your historical refund rate applied, then recompute with actual refunds before you record the final result.
Can RPV go up while conversion rate goes down?
Yes. If a higher price or a bigger default bundle loses a few buyers but each remaining buyer spends more, revenue per visitor rises while conversion rate falls. The reverse happens too: a cheaper offer can convert better and earn less. That is why judging a test by conversion rate alone can pick the version that makes less money.
What is the difference between revenue per visitor and revenue per session?
A visitor is one person, counted once in the period, while a session is one visit, and one person can have several. Revenue per session is lower whenever people come back, and it can penalize a variant that brings more return visits. For VSL tests, use visitors, because split tests assign and remember people rather than sessions.