
Contribution margin in ecommerce: the formula, CM1 to CM3, and why gross margin misleads your ad spend
Contribution margin is what an order leaves after every cost that comes with it: product, shipping, fulfillment, payment fees, refunds and chargebacks. Here is the formula, a P&L for one order, the CM1 to CM3 layers, how it differs from gross margin, and what to do with the number.
On this page
- What is contribution margin in ecommerce?
- The contribution margin formula, with a P&L for one order
- Contribution margin calculator
- How to track contribution margin by product
- CM1, CM2 and CM3: contribution before and after ads
- What to do with your contribution margin
- Contribution margin vs gross margin
- Common contribution margin mistakes
- A contribution margin checklist for this week
- Frequently asked questions
Contribution margin is the share of revenue an order leaves after every cost that comes with it: the product's landed cost, shipping and fulfillment, payment fees, refunds, chargebacks and per-order commissions. Contribution margin = (revenue − variable costs) ÷ revenue. A $100 order that carries $39 of those costs leaves $61 of contribution, a 61% margin: the money available to pay for ads, then fixed costs and profit.
What is contribution margin in ecommerce?
Contribution is what one more order adds to the business before fixed costs. Contribution margin expresses it as a share of that order's revenue. The test for what belongs in it is simple: does this cost go up when you sell one more order? If yes, it's variable and it comes out. If you'd pay it anyway, it's fixed and it stays out.
Here is where $100 of revenue goes for an illustrative supplement order, ads included:
Where $100 of revenue goes
Illustrative supplement order, after ads
- Product (landed cost)$18.0018%
- Shipping and fulfillment$11.0011%
- Payment fees$4.004%
- Refunds and chargebacks$6.006%
- Ad spend$38.0038%
- Left for fixed costs and profit$23.0023%
The variable costs of a typical store order:
- Product, landed. Manufacturing, packaging, inbound freight and duties, per unit, times the units in the order.
- Shipping and fulfillment. Postage, pick and pack, the box and the inserts, including on orders where the buyer pays nothing for shipping.
- Payment fees. The processor's percentage plus any fixed fee per transaction.
- Refunds. Revenue you give back. With consumables, the product and the postage usually aren't recovered.
- Chargebacks. The disputed amount plus a fee. Stripe, for example, charges US businesses $15 per dispute (Stripe pricing) and, outside Mexico, keeps it even when you win (how disputes work).
- Variable marketing. Affiliate commissions and any fee paid per sale. Ad spend is variable too, but it's kept in its own layer so you can see what ads can cost.
Fixed costs stay out: salaries, rent, software subscriptions, the VSL you already paid to make. They matter, but they don't change with the next order, so they get paid out of contribution rather than subtracted from it.
The contribution margin formula, with a P&L for one order
Here is the full P&L for the illustrative $100 order, every line shown as a share of revenue:
| Line | Per order | Share of revenue |
|---|---|---|
| Revenue | $100.00 | 100% |
| Refunds and chargebacks | −$6.00 | 6% |
| Product (landed cost) | −$18.00 | 18% |
| Shipping and fulfillment | −$11.00 | 11% |
| Payment fees | −$4.00 | 4% |
| Contribution before ads | $61.00 | 61% |
| Ad spend per order | −$38.00 | 38% |
| Contribution after ads | $23.00 | 23% |
Scale it to a month and the fixed costs come into view. At 1,500 orders, contribution before ads is $91,500 and contribution after ads is $34,500. With $25,000 of fixed costs, the month makes $9,500. Every line in the table moves that result: a refund rate one point higher costs $1,500 a month at this volume.
Per unit, per order or per customer?
Count contribution per order for ad decisions. You pay for ads per order, and shipping, fulfillment and payment fees also come per order, so a per-unit figure hides the part that matters. In the bundle example further down, a single bottle leaves $27.10 and a three-bottle box leaves $80.10. Per bottle they look alike ($27.10 against $80.10 ÷ 3 = $26.70). Per order, which is what an ad pays for, the box leaves almost three times as much. Per customer, across every order they place, is the level above: lifetime contribution.
Contribution margin calculator
The calculator below starts with the $100 order from the table: $18 of product, $11 of shipping and fulfillment, 4% payment fees and 6% refunds and chargebacks. Put affiliate commissions, per-order apps or a gift in the box under other costs. The contribution margin it shows is contribution before ads, and the break-even figures are the most an order can pay for its ads.
Calculator
Break-even ROAS and CPA calculator
Your numbers per order. Below the break-even ROAS, every order loses money before fixed costs.
- Profit per order before ads
- Contribution margin
- Break-even cost per order (CPA)
ROAS = revenue ÷ ad spend. Refunds are counted as revenue you give back; the product cost and shipping of a refunded order are already spent.
Run it for each offer you sell, not once for the whole store. A single bottle, a bundle and an upsell each have their own margin, and the store-wide average hides the one that loses money.
How to track contribution margin by product
A margin worked out once in a spreadsheet goes stale the day a supplier raises a price or a carrier changes its rates. Tracking it on every order, by product and campaign, catches that.
In RevvyScales, profit tracking (Growth plan and up) subtracts ad spend from a connected Meta account, product costs (COGS) and gateway fees from revenue, and shows ROAS and margin by campaign (profit tracking). You enter each product's cost and your gateway fees on the Costs page (product costs).
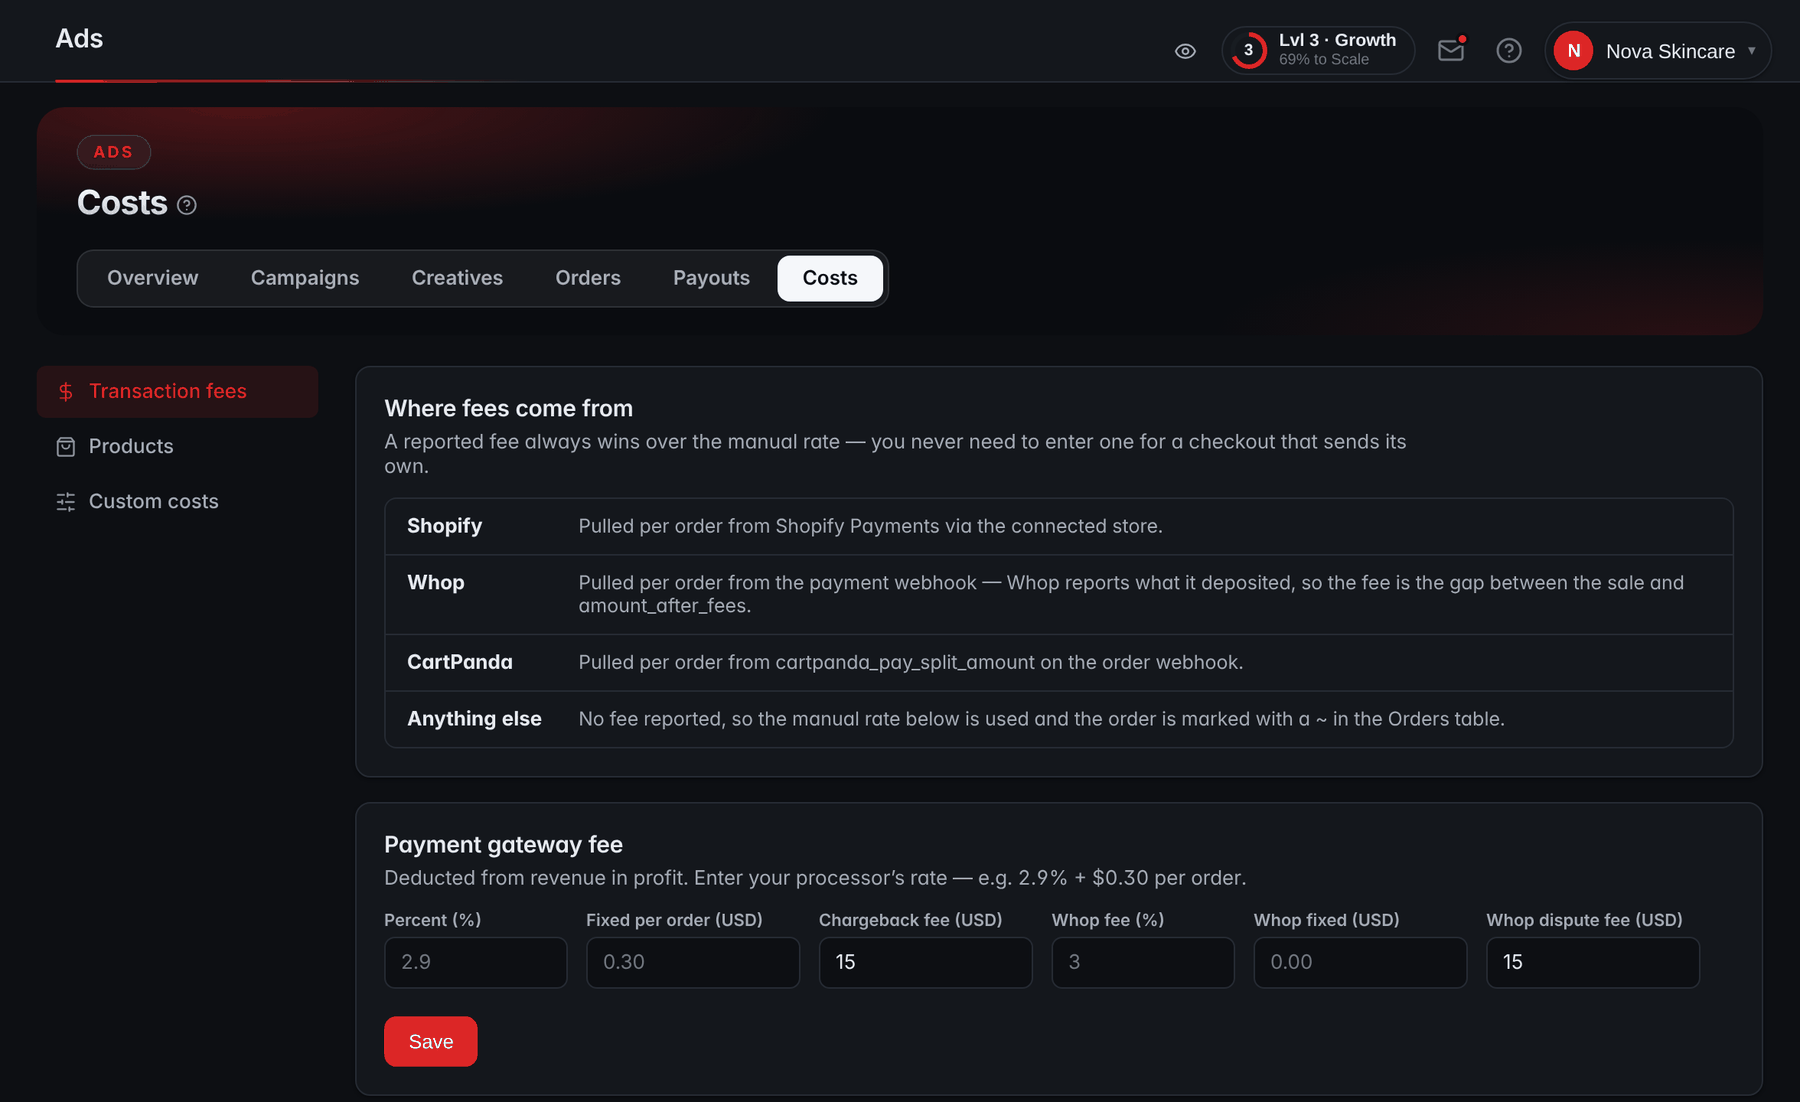
Whatever tool you use, check its refund and chargeback numbers against your processor's reports every month. Those two lines move the most and arrive last.
CM1, CM2 and CM3: contribution before and after ads
Splitting contribution into layers shows which kind of cost is moving. The labels CM1, CM2 and CM3 aren't a formal standard; here is one clear way to draw them:
- CM1 = net revenue − product cost. It tells you whether the price and the supplier quote work.
- CM2 = CM1 − shipping, fulfillment, payment fees and other per-order costs. This is contribution before ads: the most you can pay to acquire an order.
- CM3 = CM2 − ad spend. This is contribution after ads: what's left for fixed costs and profit.
Here is the same $100 order walking down the layers:
From a $100 order to CM3
Illustrative example, per order
What each layer tells you on this order:
- CM1 of $76 says the product is priced well against its cost. If CM1 is thin, no amount of ad work saves the offer.
- CM2 of $61 sets your ad limits: break-even CPA is $61 and break-even ROAS is $100 ÷ $61 = 1.64x. The break-even ROAS post turns this into a target, and the target CPA post shows how repeat orders raise the ceiling.
- CM3 of $23 says how much each order contributes to fixed costs. Multiply it by orders and compare with the month's fixed costs.
You'll also see refunds placed in CM2, or fulfillment in CM1. That's fine. What matters is writing down where each cost sits and keeping it there, so this month compares with last month.
What to do with your contribution margin
Price and bundle with it
Bundles raise contribution margin because several units share one shipping cost. With the same 4% fees and 6% refunds, a $49 single bottle with $9 of product and $8 of shipping leaves $27.10, a 55.3% margin. A three-bottle box at $129, with $27 of product and $9 of shipping, leaves $80.10, a 62.1% margin. At a $40 CPA, the single bottle loses $12.90 per order and the bundle makes $40.10. Bundle pricing covers how to set the tiers.
Choose which products to advertise
Rank products by contribution per order and break-even ROAS, not by revenue or gross margin. Two illustrative products at the same $60 price:
| Product A (powder tub) | Product B (capsules) | |
|---|---|---|
| Product cost | $9 | $15 |
| Gross margin | 85% | 75% |
| Shipping and fulfillment | $16 | $7 |
| Payment fees (4%) | $2.40 | $2.40 |
| Refunds | $7.20 (12%) | $1.80 (3%) |
| Contribution per order | $25.40 | $33.80 |
| Contribution margin | 42.3% | 56.3% |
| Break-even ROAS | 2.36x | 1.78x |
On gross margin, A wins. On contribution, B leaves $8.40 more per order and breaks even at a much lower ROAS. Advertise B first, and fix A's shipping weight and the causes of its refunds before you scale it.
Check every discount against it
A discount comes straight out of contribution, because the costs stay put while revenue falls. Give the $100 order a 20% coupon and revenue drops to $80. Fees and refunds shrink a little with it (4% and 6% of $80 are $3.20 and $4.80), but the $18 of product and the $11 of shipping don't move. Contribution falls from $61 to $43. The 20% discount took 30% of the contribution, so you'd need about 42% more orders to earn the same total. Run that test on every promotion before it goes live.
Remember that repeat orders skip the ad
A repeat order carries the same variable costs but usually no ad spend, so its contribution after ads is close to its contribution before ads. The customer whose first $100 order left $23 after ads leaves about $61 on a second $100 order placed from an email. That's why a thin first-order CM3 can still be a sound business, and why the LTV to CAC ratio post counts contribution across every order a customer places.
Judge pages and offers per visitor
Contribution per order says what a buyer is worth. Contribution per visitor, revenue per visitor × contribution margin, says what a page is worth. A page change that lifts conversion but sells more single bottles can lower it. The revenue per visitor guide shows how to test with it.
Contribution margin vs gross margin
Gross margin is revenue minus the cost of the goods sold, divided by revenue. On the $100 order, that's ($100 − $18) ÷ $100 = 82%. It's useful for comparing supplier quotes, and it belongs on your income statement. It's the wrong number for deciding what to pay for ads, because it leaves out everything between the warehouse and the money you keep:
Gross margin vs contribution margin
Misleads ad decisionsGross margin
Revenue minus product cost, divided by revenue.
- Leaves out shipping, fulfillment, payment fees, refunds and chargebacks
- Example order: 82%
- Implied break-even ROAS: 1.22x
Use for ad decisionsContribution margin
Revenue minus every variable cost, divided by revenue.
- Counts every cost that comes with an order
- Example order: 61% before ads
- Break-even ROAS: 1.64x
The gap turns into real losses. Say your ads run at a ROAS of 1.40x, so each $100 order carries $71.43 of ad spend. On gross margin, that looks like $10.57 of profit per order ($82 − $71.43). On contribution margin, it's a loss of $10.43 ($61 − $71.43). The team reading gross margin scales the campaign, and the bank balance shrinks.
Common contribution margin mistakes
Using gross margin for ad decisions is the first. The rest come from a handful of shortcuts:
- Using the list price. Coupons, bundle discounts and free gifts lower what you actually collect. Use the average revenue per order you received.
- Using the supplier's price instead of the landed cost. Inbound freight, duties and packaging belong in product cost.
- Forgetting free shipping. The buyer pays nothing for it; you still pay the carrier.
- Measuring refunds on young orders. Refunds arrive weeks after the sale. Use orders older than your guarantee period.
- Leaving out dispute fees. A lost chargeback costs the order plus the fee, and the fee may be charged even when you win.
- Spreading fixed costs over orders. A monthly app fee divided by this month's orders looks like a cost per order, but it doesn't grow with orders. Keep it with fixed costs, or your margin will seem to rise and fall with volume.
A contribution margin checklist for this week
- List every cost that comes with an order. Check last month's processor statement for fees and dispute fees.
- Compute contribution per order for each offer: single, bundle and upsell.
- Put CM1, CM2 and CM3 for last month in one table, and note where each cost sits.
- Replace gross margin with contribution margin in every sheet that sets ad budgets.
- Rank products by contribution per order and break-even ROAS before choosing what to advertise.
- Set a monthly reminder to update your refund and chargeback rates.
Frequently asked questions
What is the difference between contribution margin and gross margin?
Gross margin subtracts only the cost of the goods sold from revenue. Contribution margin subtracts every cost that comes with an order: the product, shipping and fulfillment, payment fees, refunds, chargebacks and commissions. On the same $100 order, gross margin can read 82% while contribution margin before ads is 61%. For ad budgets, break-even ROAS and bundle pricing, use contribution margin.
Is ad spend a variable cost in contribution margin?
It is variable, but it helps to keep it in its own layer, so you can see what ads can cost. Contribution before ads, often called CM2, tells you the most you can pay to get an order. Contribution after ads, CM3, tells you what is left for fixed costs and profit. Labels vary between companies, so define yours and keep them consistent.
What is a good contribution margin for ecommerce?
There is no universal number, because it depends on your price, product, shipping and refund rate. What matters is whether your contribution per order covers what you pay to acquire it, with room left for fixed costs. A 61% margin breaks even at a ROAS of 1.64x, and a 40% margin needs 2.50x. Work backward from the ROAS or CPA your ads actually achieve.
Should refunds be included in contribution margin?
Yes. A refund gives back revenue, and for most consumables the product and the shipping are not recovered, so the order still carries those costs. Subtract refunds as a share of revenue from your own history, measured on orders old enough for your guarantee period to have passed. Chargebacks go in too, with the dispute fee on top of the disputed amount.
How do I calculate contribution margin per product?
Take one product’s average order value, then subtract its landed product cost for the units in the order, its shipping and fulfillment, the payment fees on the order and its own refund and chargeback rate. Divide what is left by the order value. Do it per offer, since a three-bottle bundle shares one shipping cost and usually has a higher margin than a single bottle.