
Break-even ROAS: the formula, a calculator and what to do when you are below it
Break-even ROAS is the return on ad spend at which an order pays for its own ads and nothing more. Here is the formula, the costs that go into it, a calculator set to a worked example, how it differs from a target ROAS, and why the ROAS in your ad account isn't the one that pays you.
On this page
- How do you calculate break-even ROAS?
- What counts as a cost in the break-even ROAS formula?
- Break-even ROAS calculator with a worked example
- Why low-margin offers need a much higher ROAS
- Break-even ROAS vs target ROAS
- Why the ROAS in your ad account isn't your real ROAS
- How to track ROAS against break-even by campaign
- What to do when ROAS is below break-even
- A break-even ROAS checklist for this week
- Frequently asked questions
Break-even ROAS is the return on ad spend at which the money an order leaves, after every cost except ads, exactly pays for the ads that brought it. The formula: break-even ROAS = average order value ÷ contribution per order before ads, which is the same as 1 ÷ contribution margin. A $120 order that keeps $78.20 after product, shipping, fees and refunds breaks even at 1.53x.
How do you calculate break-even ROAS?
ROAS, return on ad spend, is the revenue your ads brought in divided by what they cost. Google's own example is $5 of sales for every $1 of ad spend: a ROAS of 5x, which Google Ads writes as a 500% target ROAS (Google Ads Help). Break-even ROAS is the point where what's left of each order, after every cost except ads, equals the ad spend it took to get that order.
The break-even ROAS formula
Contribution per orderorder value − product − shipping and fulfillment − payment fees − refunds and chargebacks − other per-order costs
Break-even ROASaverage order value ÷ contribution per order
Break-even ROAS1 ÷ contribution margin
Example: $120 ÷ $78.20 = 1.53x, the same as 1 ÷ 0.652 (a 65.2% contribution margin).
Why it works: at a ROAS of R, each order carries average order value ÷ R of ad spend. Profit per order is then contribution − AOV ÷ R, which reaches zero exactly when R = AOV ÷ contribution. Above that line, each order adds profit. Below it, each order takes some away.
The same line has a second name. Break-even CPA is the contribution per order itself: the most you can pay in ads for one order. In the example, break-even CPA is $78.20 and break-even ROAS is $120 ÷ $78.20 = 1.53x. Bid in whichever unit your campaign uses, cost per purchase or ROAS, and keep the other written next to it.
What counts as a cost in the break-even ROAS formula?
Count everything you pay because an order happened, and nothing you'd pay anyway.
- Product cost, landed. What the units in one order cost delivered to your warehouse: manufacturing, packaging, inbound freight and duties. For a bundle, multiply by the units in it.
- Shipping and fulfillment. Postage, pick and pack, the box and the inserts. Free shipping for the buyer is still a cost for you.
- Payment fees. The processor's percentage and any fixed fee per transaction, charged on the full order value.
- Refunds and chargebacks. A share of revenue, taken from your own history. A refunded order of a consumable usually still cost you the product and the postage. A chargeback costs the order plus a fee: Stripe charges US businesses $15 per dispute (Stripe pricing) and, outside Mexico, never returns it, even when you win (how disputes work).
- Other per-order costs. Affiliate commissions, apps billed per order, a gift in the box, the replacement you send when a parcel goes missing.
Leave out fixed costs: salaries, software subscriptions, the VSL you already paid to produce. They don't change with one more order, so they belong in your target ROAS, not in your break-even.
Here is where the money of the $120 order from the formula goes:
Where a $120 order goes before ads
Illustrative example, per order
The mistake to avoid is using product cost alone. With only the $22 of product subtracted, the margin looks like 81.7% and break-even ROAS like 1.22x. A campaign running at 1.40x would then look profitable while it loses $7.51 on every order: $78.20 of real contribution minus $85.71 of ad spend. The contribution margin post goes through every cost line and the difference from gross margin.
Break-even ROAS calculator with a worked example
Say a supplement brand sells mostly three-bottle bundles through a VSL, and its average order is $120. Each order costs $22 in product and $9 to ship and fulfill. The processor takes 4%, and refunds and chargebacks have run at 5% of revenue. The calculator below starts with those numbers; change any field to yours.
Calculator
Break-even ROAS and CPA calculator
Your numbers per order. Below the break-even ROAS, every order loses money before fixed costs.
- Profit per order before ads
- Contribution margin
- Break-even cost per order (CPA)
ROAS = revenue ÷ ad spend. Refunds are counted as revenue you give back; the product cost and shipping of a refunded order are already spent.
Each order leaves $78.20 before ads, a 65.2% contribution margin, so the brand breaks even at 1.53x and can pay up to $78.20 in ads per order. Here is what the same order earns at different ROAS levels:
| ROAS | Ad spend per order | Profit per order before fixed costs |
|---|---|---|
| 1.25x | $96.00 | −$17.80 |
| 1.50x | $80.00 | −$1.80 |
| 2.00x | $60.00 | $18.20 |
| 2.50x | $48.00 | $30.20 |
Two things stand out. Near break-even, small gaps matter: 1.50x looks close to 1.53x and still loses $1.80 an order. And refunds move the line: at a 10% refund rate instead of 5%, break-even rises from 1.53x to 1.66x, so recheck it whenever your refund rate changes.
Why low-margin offers need a much higher ROAS
Break-even ROAS is 1 divided by your contribution margin, so it doesn't move in a straight line. Halve the margin and the ROAS you need doubles:
Break-even ROAS by contribution margin
Computed as 1 ÷ margin
The curve gets steep at the bottom. Going from a 50% to a 40% margin raises break-even by half a point, from 2.00x to 2.50x. Going from 30% to 20% raises it by 1.67 points, from 3.33x to 5.00x. Whether your ads can hold 3.33x on cold traffic is a question for your own data, but it's a much harder target than 1.53x.
This is one reason single-unit offers struggle on paid traffic. A $49 single bottle with $9 of product, $8 of shipping, 4% fees and 5% refunds leaves $27.59, a break-even of 1.78x. A three-bottle box at $129 shares one $9 shipping cost and leaves $81.39, a break-even of 1.58x. The bundle needs a lower ROAS and leaves almost three times as much per order to pay for the ad. Bundle pricing covers how to set the tiers.
Break-even ROAS vs target ROAS
Break-even is the floor; a target is what you plan for. Your target ROAS has to cover the two things break-even leaves out: fixed costs and the profit you want.
Back to the $120 order. Say the brand's fixed costs are $9,000 a month and it sells 600 orders a month: $15 of fixed costs per order. It wants $10 of profit per order. Target ROAS = $120 ÷ ($78.20 − $15 − $10) = $120 ÷ $53.20 = 2.26x. Just covering fixed costs, with no profit, takes $120 ÷ $63.20 = 1.90x.
Volume changes the answer. At 1,200 orders a month, fixed costs fall to $7.50 per order and the same $10 of profit needs only $120 ÷ $60.70 = 1.98x. That's the honest case for scaling a campaign that sits between break-even and target: more orders spread the fixed costs, as long as each extra order still clears break-even.
When you type a target into a platform, use its units. Google's Target ROAS takes a percentage, so 2.26x becomes 226%. In Meta, an ad set that optimizes for value shows Highest Value as its bid strategy in Ads Manager, and Meta's API offers a minimum ROAS option, the lowest return from ad spend you'll accept (Meta for Developers). Either way, the platform judges the target on the revenue it attributes to its own ads, which is not the same as yours.
Why the ROAS in your ad account isn't your real ROAS
A platform's ROAS is a good compass for comparing ads inside that platform. It's a poor judge of whether you're above break-even, for four reasons.
- Attribution windows. A platform counts a sale only if it happens within a set time after someone interacts with an ad (how Meta's window works). In Google Ads that window is set per conversion action, from 1 to 90 days depending on the source, with a 30-day default for Search and Display (Google Ads Help). Sales after the window aren't counted. Sales inside it are, even when another ad did the persuading.
- Double counting. Each platform counts the sales that follow its own ads. A buyer who clicked a Meta ad on Monday and a Google ad on Wednesday can show up in both reports.
- Gross values. Meta's ROAS metrics take their purchase value from the Purchase events your pixel or app reports (Meta for Developers). That value is captured when the order happens, before anyone knows which orders will be refunded or disputed, and cardholders can typically dispute a card payment within 120 days, sometimes longer (Stripe).
- Missing events. If your thank-you page breaks or a checkout never sends the purchase, the platform under-counts and a good campaign looks bad.
So check the platform against your own books. Say that in one week Meta reports 1.80x on $15,000 of spend ($27,000 in purchases) and Google reports 2.40x on $7,000 ($16,800). Together they claim $43,800. Your store took $36,000 in orders those days. Real ROAS, or marketing efficiency ratio: $36,000 ÷ $22,000 = 1.64x. That's above the 1.53x break-even, but at this brand's margin ($78.20 kept from every $120), $36,000 of revenue leaves $23,460, so the week cleared just $1,460 after $22,000 of ads. Neither report suggested a margin that thin. If part of that revenue would have come anyway, from email or returning buyers, real ROAS from ads is lower still.
One rule keeps the comparison honest: count refunds once. The calculator measures ROAS on gross revenue and treats refunds as a cost per order. If you'd rather measure ROAS on net revenue, take refunds out of the cost list. Doing both makes your results look worse than they are; doing neither makes them look better.
How to track ROAS against break-even by campaign
The check above takes a spreadsheet and an afternoon, so it's easy to do it once and then drift back to the platform's number. It holds up better when costs are entered once and the subtraction runs every day.
Profit tracking in RevvyScales (Growth plan and up) subtracts ad spend from a connected Meta account, product costs and gateway fees from revenue, and shows ROAS and margin by campaign (profit tracking). You enter each product's cost in product costs.
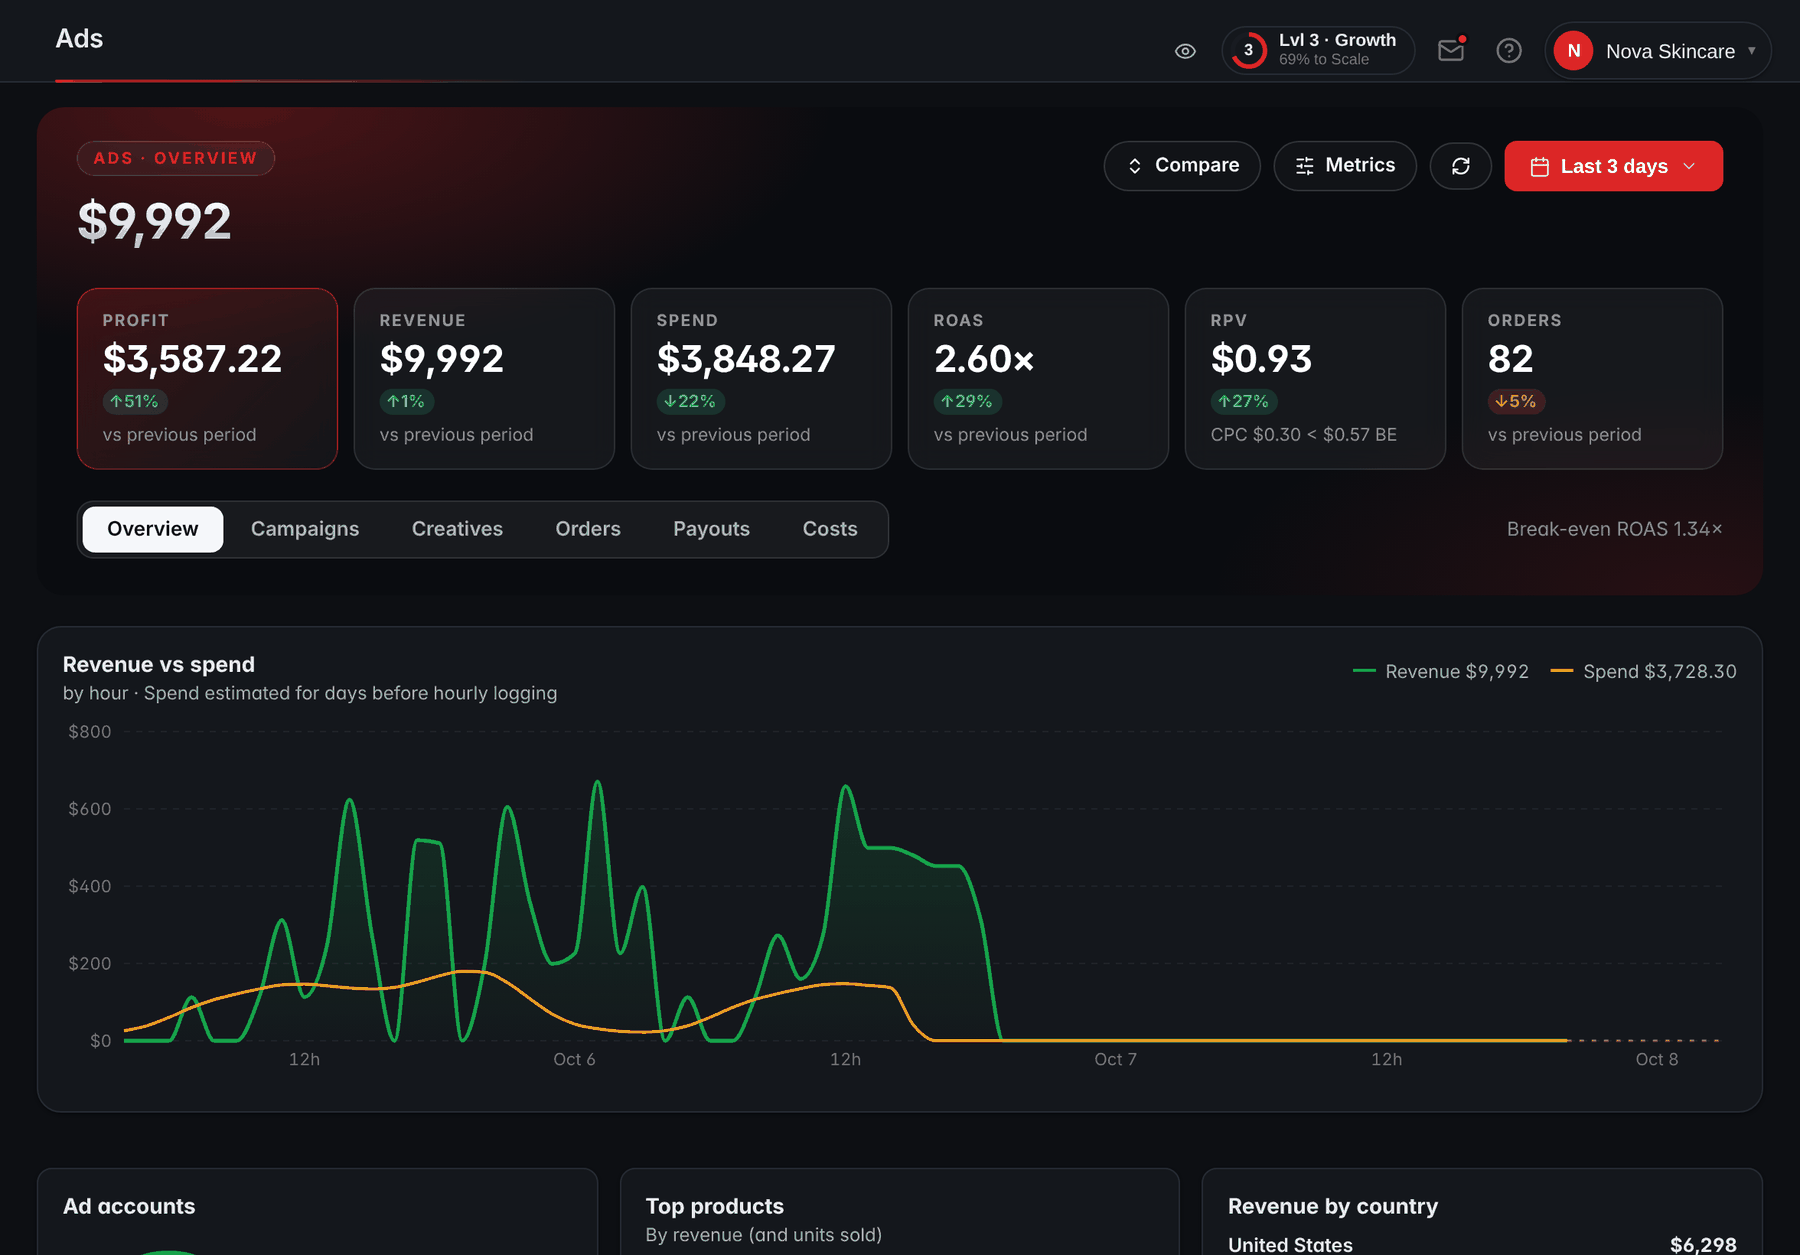
Whatever tool you use, read it the same way: any campaign whose real ROAS stays below your break-even for a full week of steady spend needs one of the fixes below, or a smaller budget while you work on them.
What to do when ROAS is below break-even
There are four levers. The first two move the break-even line, the third moves your ROAS, and the fourth limits the damage.
- Raise the order value. Bundles and post-purchase upsells add revenue to the same shipping cost and the same ad. Moving buyers from the $49 single bottle to the $129 three-pack drops break-even from 1.78x to 1.58x in the example above. The VSL offer guide covers how to present bundles at the pitch.
- Cut the cost per order. Re-quote the product at your real volumes, compare fulfillment partners, and work on the causes of refunds. Cutting refunds from 5% to 3% on the $120 order adds $2.40 of contribution and lowers break-even from 1.53x to 1.49x.
- Fix conversion. Conversion rate isn't in the formula, but it sets your ROAS. If visitors cost $1.20 each and 2.0% of them buy, each order costs $60 in ads and ROAS is 2.00x. At 1.5%, each order costs $80 and ROAS falls to 1.50x, below break-even. The revenue per visitor guide shows how to judge page changes in dollars per visitor.
- Stop. If an offer can't clear break-even on paper even after the first three levers, more spend only makes the loss bigger. Pause it, fix the offer, then come back.
A break-even ROAS checklist for this week
- Pull last month's real numbers: average order value, product cost per order, shipping and fulfillment, payment fees, and the refund and chargeback rate.
- Run them through the calculator above and write the break-even ROAS and CPA next to your ad account's name.
- Add fixed costs per order and the profit you want to get your target ROAS.
- Divide last week's store revenue by all ad spend for the same days. Is real ROAS above break-even?
- Rank campaigns by real ROAS against break-even, not by the platform's ROAS.
- Recompute every month, and every time a price, a bundle, a supplier or your refund rate changes.
Frequently asked questions
What is a good ROAS for ecommerce?
A good ROAS is one above your target ROAS: your break-even ROAS plus your fixed costs and the profit you want. There is no universal number. A brand with a 65.2% contribution margin breaks even at 1.53x, while one with a 30% margin needs 3.33x. Generic ROAS benchmarks ignore your prices, product costs and refund rate, so work out your own break-even first and judge every campaign against it.
Is break-even ROAS the same as break-even CPA?
They describe the same line from two sides. Break-even CPA is your contribution per order, the most you can spend in ads to get one order without losing money. Break-even ROAS is your average order value divided by that amount. With a $120 average order and $78.20 of contribution, break-even CPA is $78.20 and break-even ROAS is 1.53x.
Should refunds be part of break-even ROAS?
Yes, counted once. Either measure ROAS on gross revenue and treat refunds and chargebacks as a cost per order, as the calculator does, or measure ROAS on net revenue and leave refunds out of the costs. Counting them in both places makes your results look worse than they are, and leaving them out of both makes them look better.
How do I convert ROAS into a percentage?
Multiply by 100. A ROAS of 1.53x means $1.53 of revenue for every $1 of ad spend, which is 153%. Google Ads asks for target ROAS as a percentage; its own example is $5 of sales for each $1 of spend, a 500% target ROAS. Most dashboards show the multiple instead. The math is the same either way.
Why is my break-even ROAS so high?
Usually because your contribution margin is low: a low price, a high product cost, expensive shipping or a high refund rate. Break-even ROAS is 1 divided by the margin, so it climbs fast as the margin falls: 2.50x at 40%, 5.00x at 20%. Bundles that share one shipping cost, better supplier prices and fewer refunds bring it down. Also check that no fixed cost slipped into your per-order costs.